Site Visitor Behavior
State: All |
All FormsForm completion: Forms startedForms completed |
Hunter | Nipun | Dhiksha | Namra | Dominic
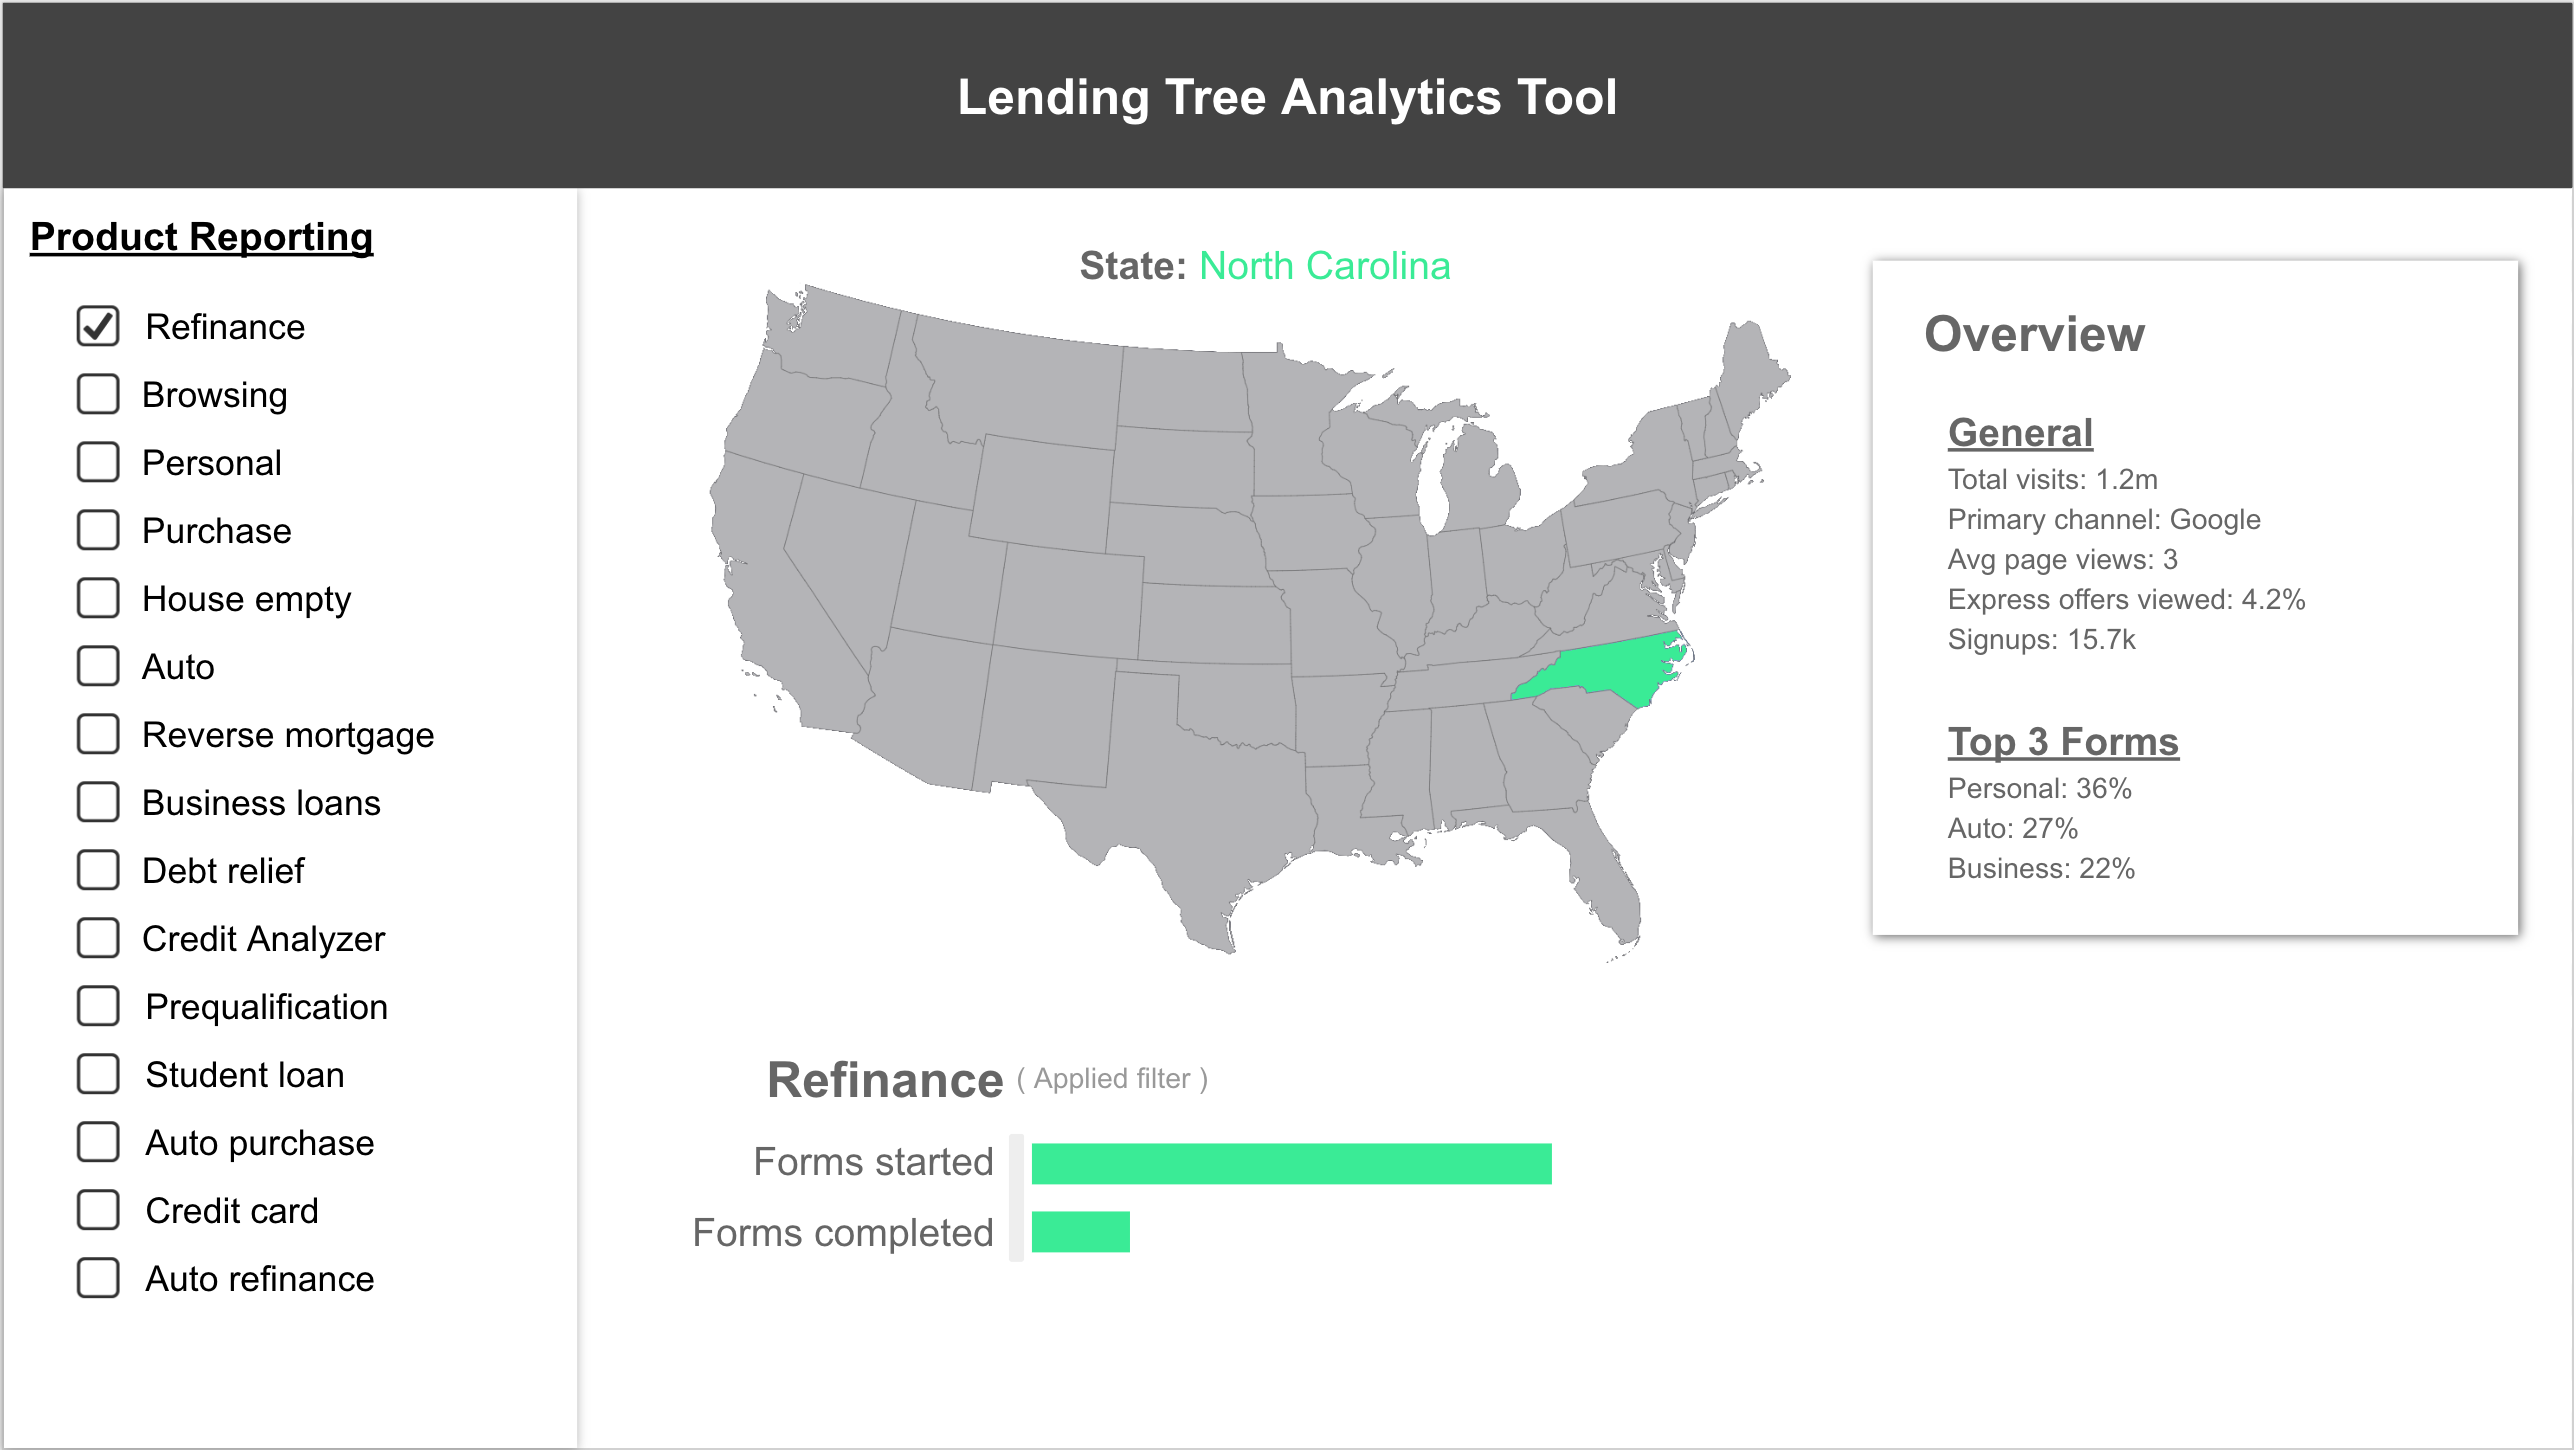
Our motivation and vision for this visual tool was to take data about the websites visitor behavior, as provided by LendingTree, and evaluate any trends or relationships within the data.
With our visualization we would like to display comparisons between the US States based on several visiting attributes and events. This visualization can be useful in narrowing the focus of advertising for specific states or regions based on their most viewed attributes.
We can see what people in each state are more likely to look for on the website and push that for them so they can find it easier. If people visiting the website can quickly find what they are looking for then they will not be irritated with wasted time spent on searching through forums they do not need. This will eventually lead to better efficiency and a higher quality experience for the user.
Looking at our visualization we found that California submitted many more forms than all other states in every single category tested. We also found that almost every state had the same top three most popular activities, which were Refinance, Browsing, and Personal. The only exceptions to this were the states Montana, New York, and Utah in which the top three activities were Refinance, Browsing, and Purchase.